
Attendance in Introductory Physics Courses
–M.M. Jarrio
The one who does not remember history is bound to live through it again.
–George Santayana
The following information is based on attendance data for over 2500 students who have taken PHYS 2212 between 2005 and 2008. It includes every section since Fall 2005 for which reliable attendance records were kept. Note, too, that statistics prior to 2005, as well as after 2008, show the same general trends—as do the statistics for PHYS 2211.
Students taking either of the introductory physics courses are strongly advised to pay heed to the conclusions reached below–they directly contradict some of the common student misconceptions about the impact of attending class.
Preliminaries
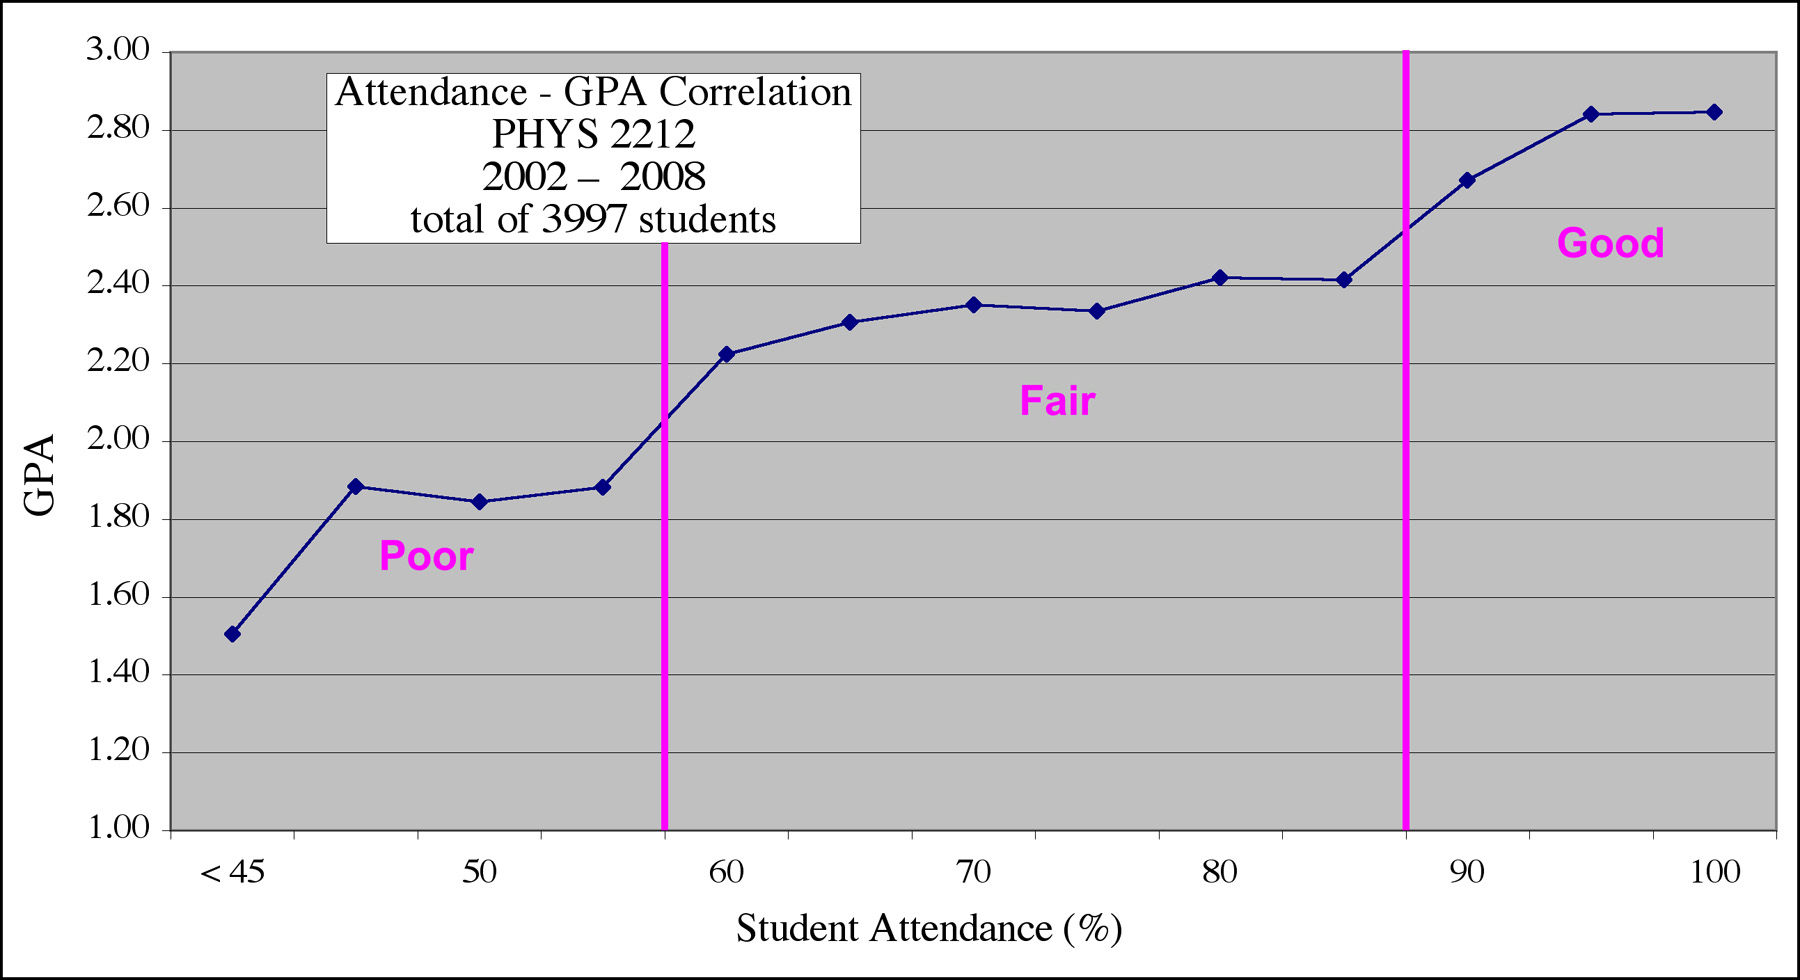
To begin, attendance records can be divided into one of three categories: Good, Fair, or Poor:
- Good - maintain 90% or better attendance over the course of the term
- Fair - maintain 60% to 89% attendance over the course of the term
- Poor - maintain less than 60% attendance over the course of the term
These breakpoints were were chosen for two reasons:
- Historically, we find that about one third of all students fall into each category.
- 2212 GPAs plotted as a function of attendance rate show three distinct tiers, illustrated quite nicely by the cumulative data going all the way back to 2002:
Attendance & Final Grades
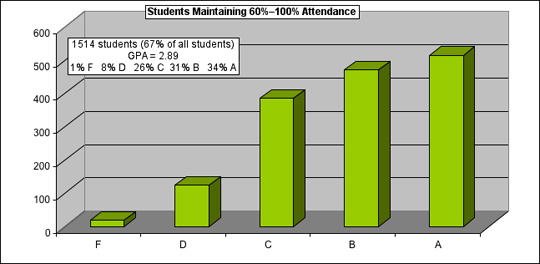
Let's begin by considering the distribution of letter grades within each category, for our
our database of recent
students:
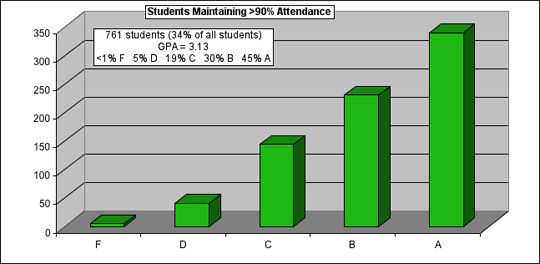
A few points worth emphasis:
- Only 6% of students with Good attendance earn D's or F's, while three fourths of them
earn A's or B's. In other words: students maintaining Good attendance are
twelve times likelier to earn a good grade (A or B) than
a bad grade (D or F).
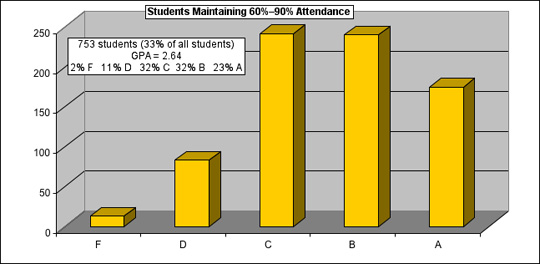
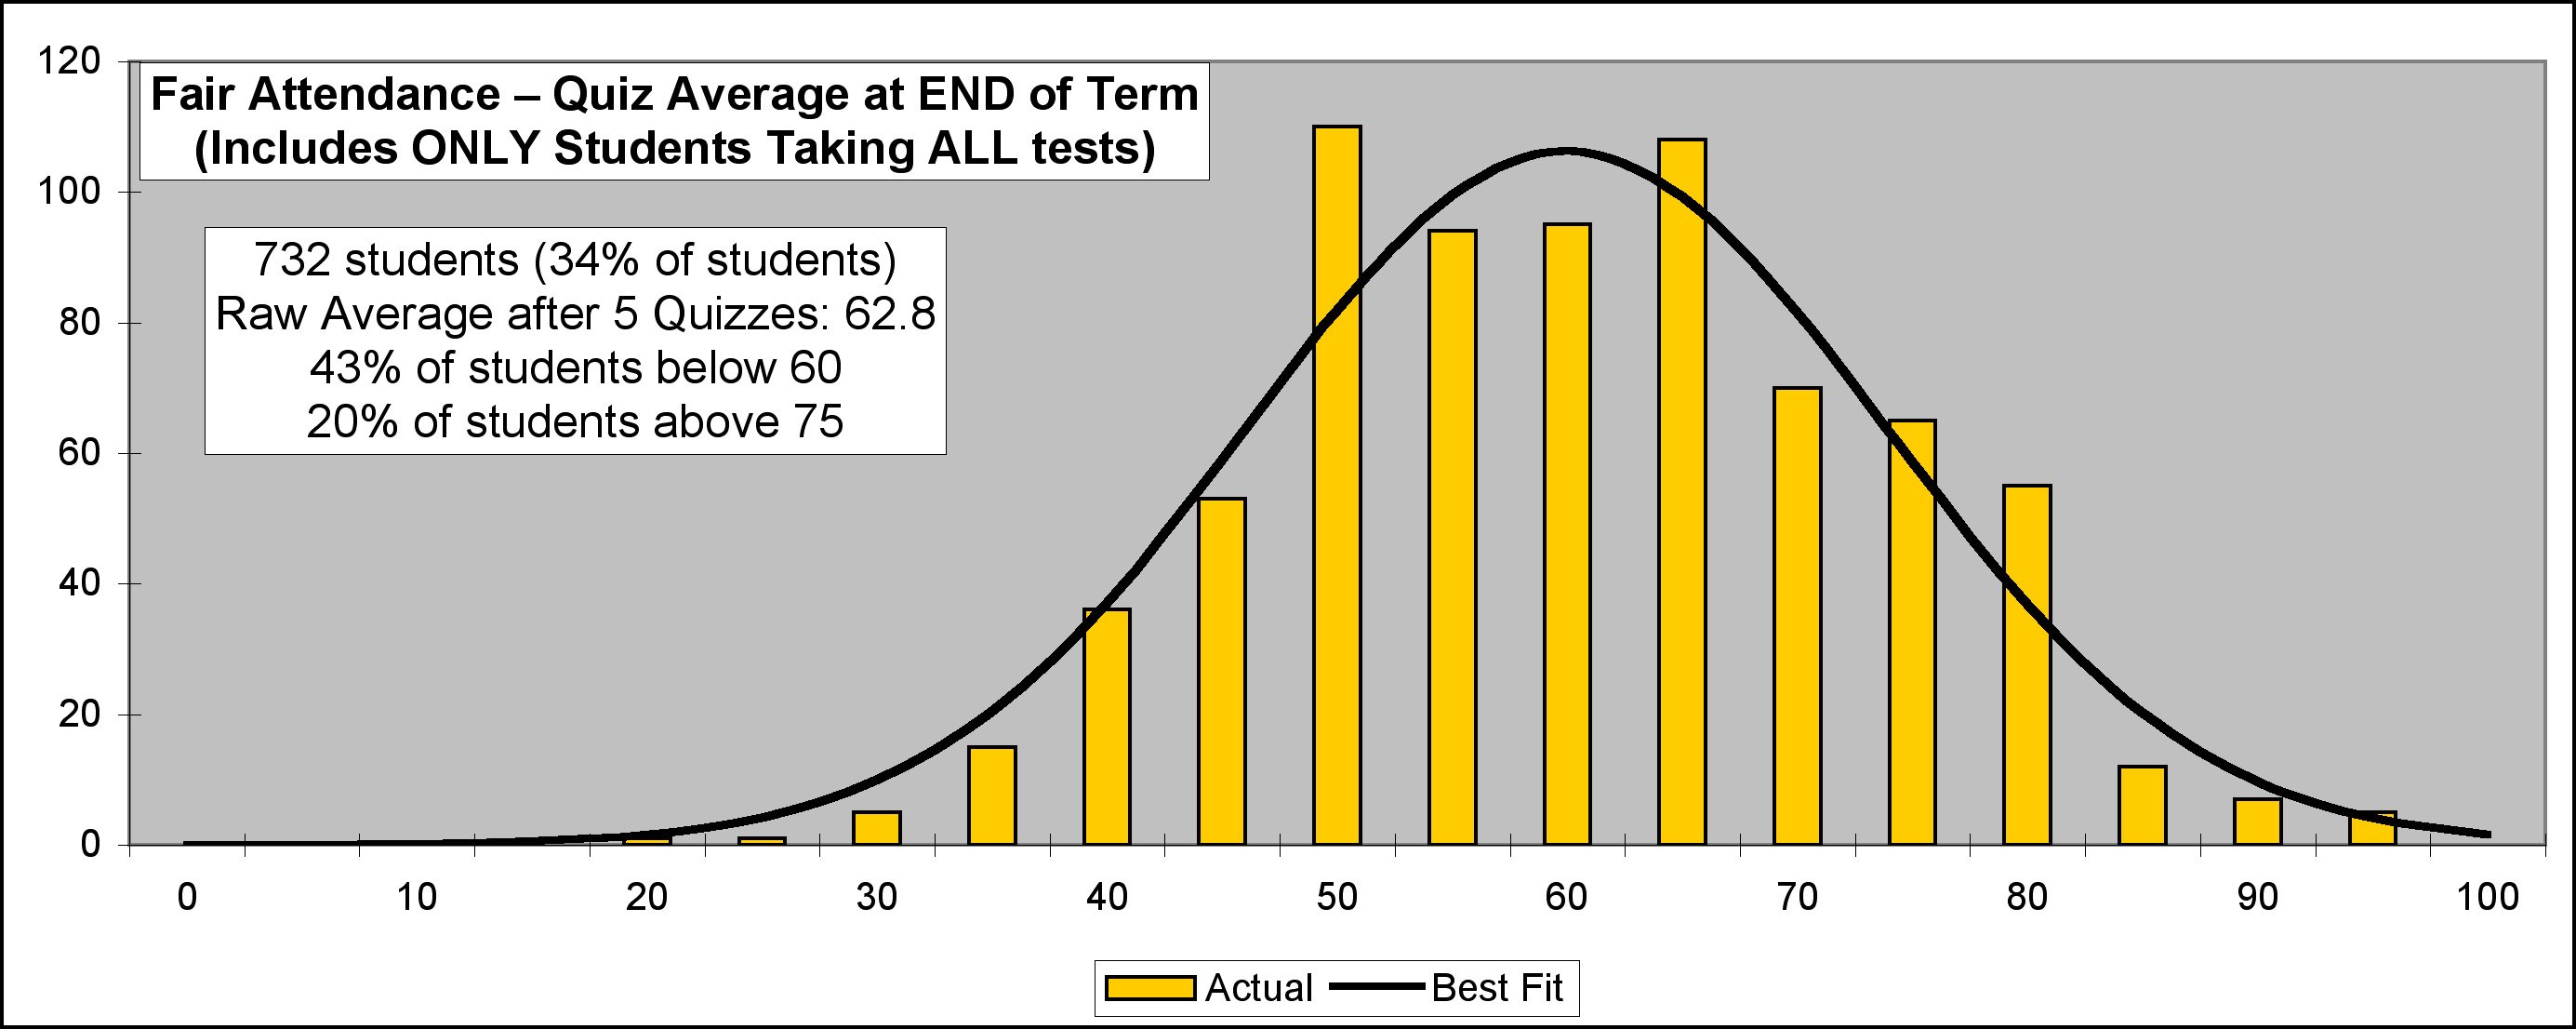
- Among students with Fair attendance, 55% earn A's or B's, while only 13% earn D's or F's.
The
good-to-bad
grade ratio is thus four to one–still a very good ratio, but note that the likelihood of a getting a D has doubled, while the likelihood of getting an A has been halved.
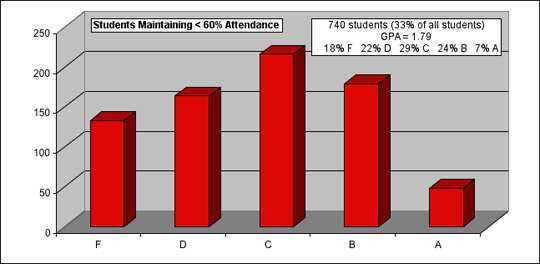
- Among students with Poor attendance, more students earn bad grades than good grades. Note that
these students, although they make up only one third of all students, earn 68% of all
D's and F's awarded in 2212–meaning that the other two-thirds of all students
only earn 32% of all D's and F's. The upshot of all this is that students
with Poor attendance are four times likelier to earn D's or F's
than everone else!
- If you combine both the Fair and Good categories to get a
Not Bad
attendance group (60% attendance or better), you will find an overall 2.89 GPA, and two thirds of these students will earn A's or B's. Over 80% of all good grades go to the students with at least Fair attendance.
It is worth noting that the grade distribution for students maintaining a Not Bad
attendance record is virtually identical to the distribution of grades for
students who make a Not Bad
effort
to do extra assigned homework. This suggests that the cutoffs selected for both attendance
and extra homework are not as arbitrary as one might suspect.
Attendance, PRS Scores, & Letter Grades
In the terms used for this study, attendance (via the PRS) actually counted for points (typically
5%) toward each student's final grade. A student with Good attendance might be expected to earn
90% or better on the PRS, for about 4.5 Class Participation
points, while a student with
Poor attendance might only earn 35% on the PRS, for 1.75 Class Participation points–ending
roughly 3 points lower than those with Good attendance, at term's end. All other
things being equal, and assuming a standard grade scale of ten points per letter grade, the
expected GPA difference between the two groups would be just 0.3 grade points. But if
you review the figures above, you'll see that the actual GPA difference between Good and
Poor attendance is 1.34 grade points (3.13 vs. 1.79). The true value of going to class is
about five times greater than that the nominal points awarded through
the PRS.
Attendance & Test Scores
Hopefully, by this point you're asking the question, Why is the actual GPA difference so much
bigger than the PRS point values for attendance?
The answer lies in the the assumption
above about ...all other things being equal...
. The truth is—contrary to what
every student might wish to believe—students who don't go to class do not
perform equally well with their peers that do attend. This can be clearly demonstrated by
looking at the test scores of the two populations. Before we do, let's review
the two common student rebuttals to required attendance policies:
- Why should I have to go to class, if I can get A's on all my quizzes
without attending?
- Why should I have to go to class, if I can do just as well on the quizzes without attending?
As for Argument 1: yes, there is a small number of people who can routinely skip class and still get A's on their tests, but in reality the number who actually do so is exceedingly small—only about half of one percent of students with Poor attendance end up with all A's on quizzes. Contrast that with the almost 5% of students with Good attendance who end up with A's on all their quizzes, and it's easy to see that Argument 1 applies only to the best of the best (a tiny fraction of the student body), and is nothing more than a straw man argument for anyone else.
The mere possibility of Argument 1—regardless of its implausibility&mdahs;leads
students to the postulate Argument 2 as a sort of necessary corollary
, applicable to the
less-exceptional students taking 2212. Anecdotal claims notwithstanding, Argument 2 is nothing more
than wishful thinking, and is directly contradicted by the actual evidence that is
avaliable. In the plots below, you will see a breakdown of final quiz averages for students
in each of the three attendance categories. (These plots exclude data for any student who
did not take all the required quizzes–those who dropped the class, or just gave up
and quit trying are NOT part of this analysis.) For both the Good and Poor attendance categories,
test scores form an obvious Bell Curve (also known as a normal, or Gaussian,
distribution), and each plot consequently shows a best Gaussian fit to the data.
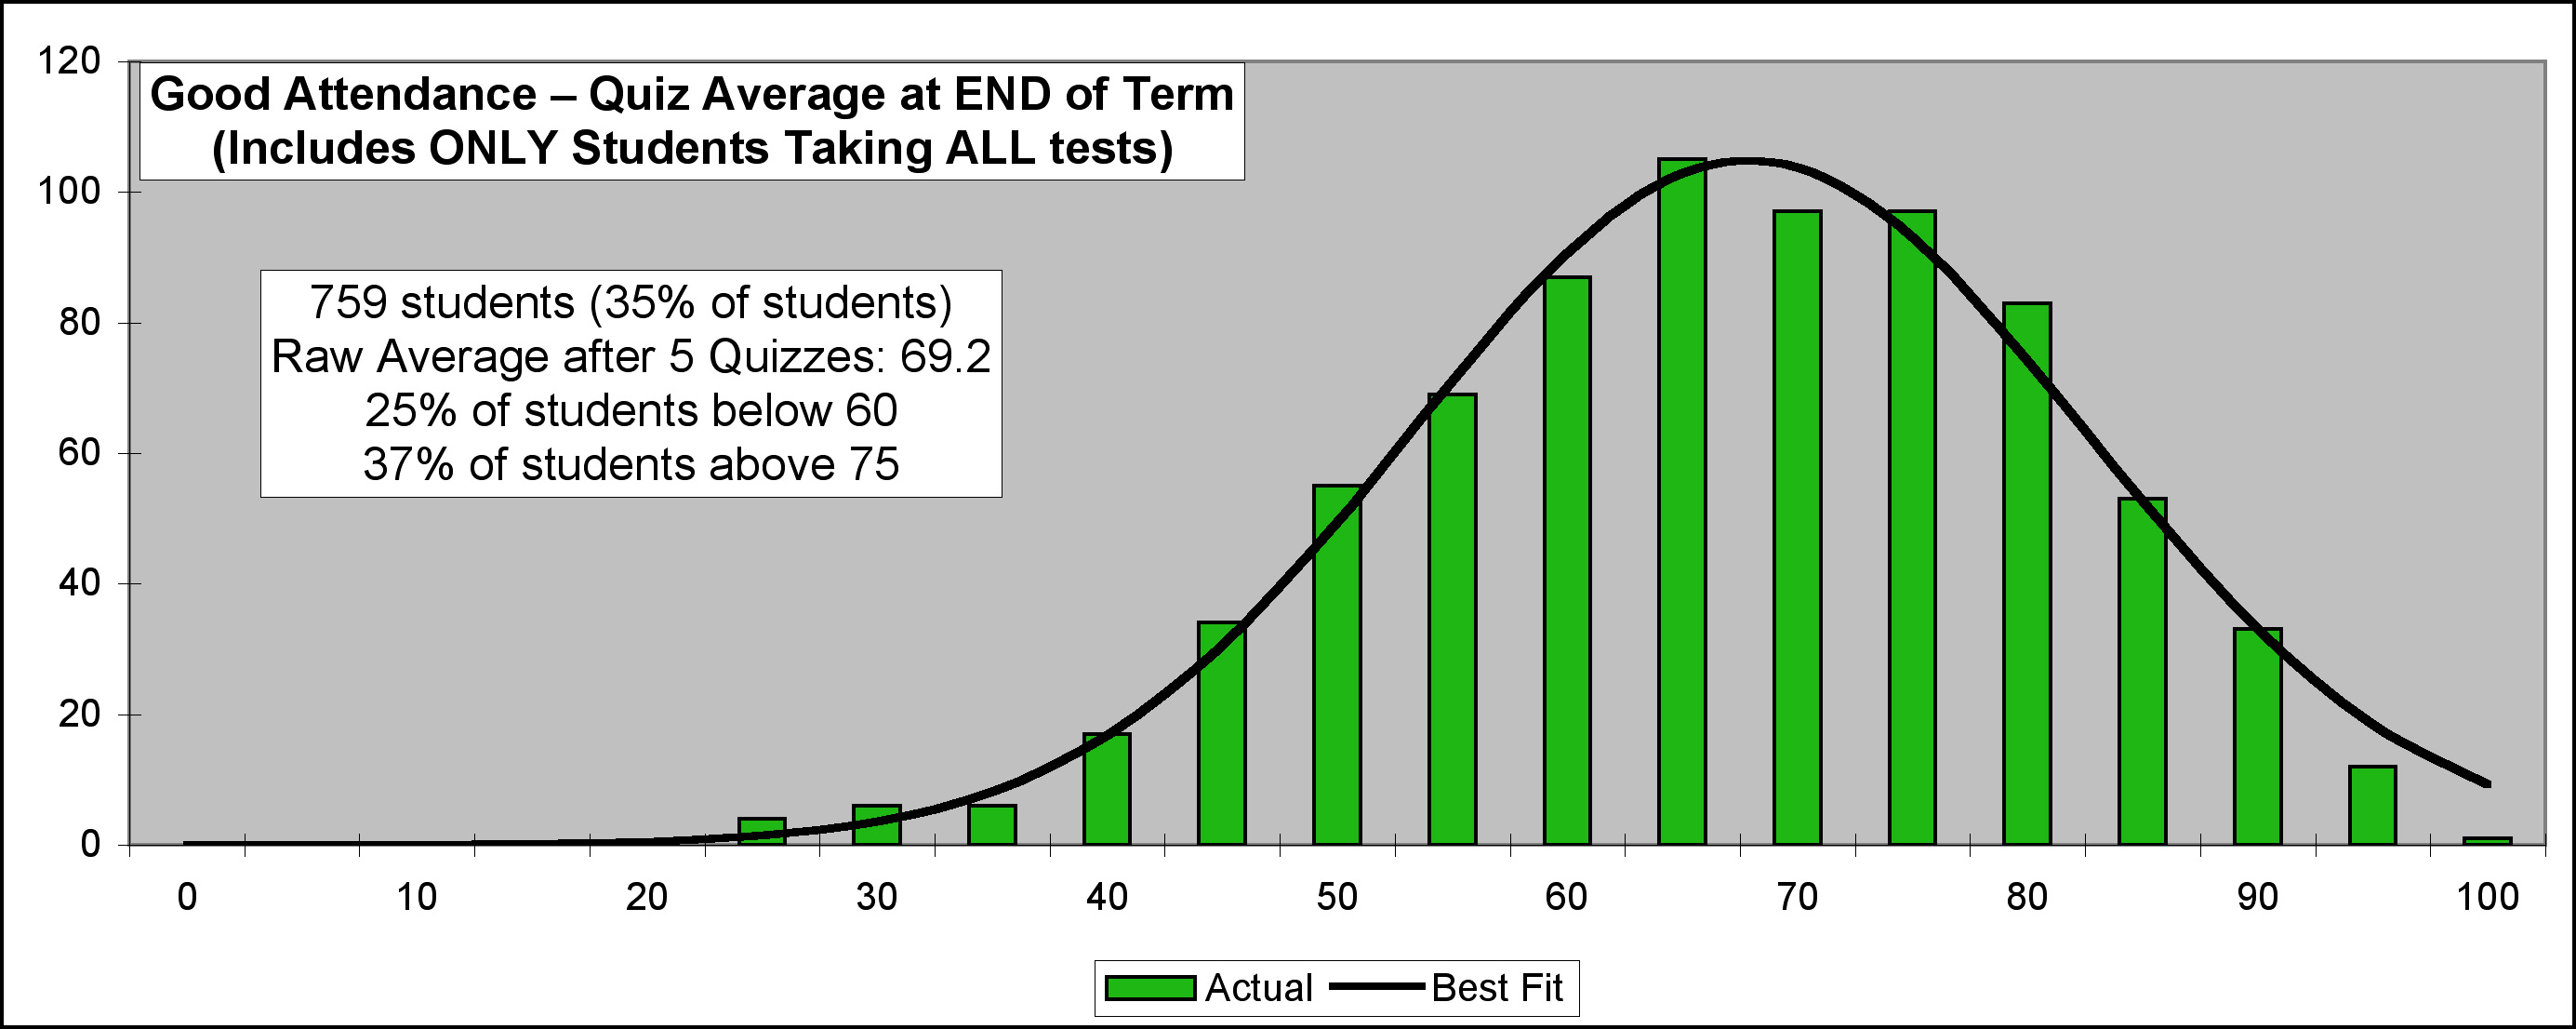
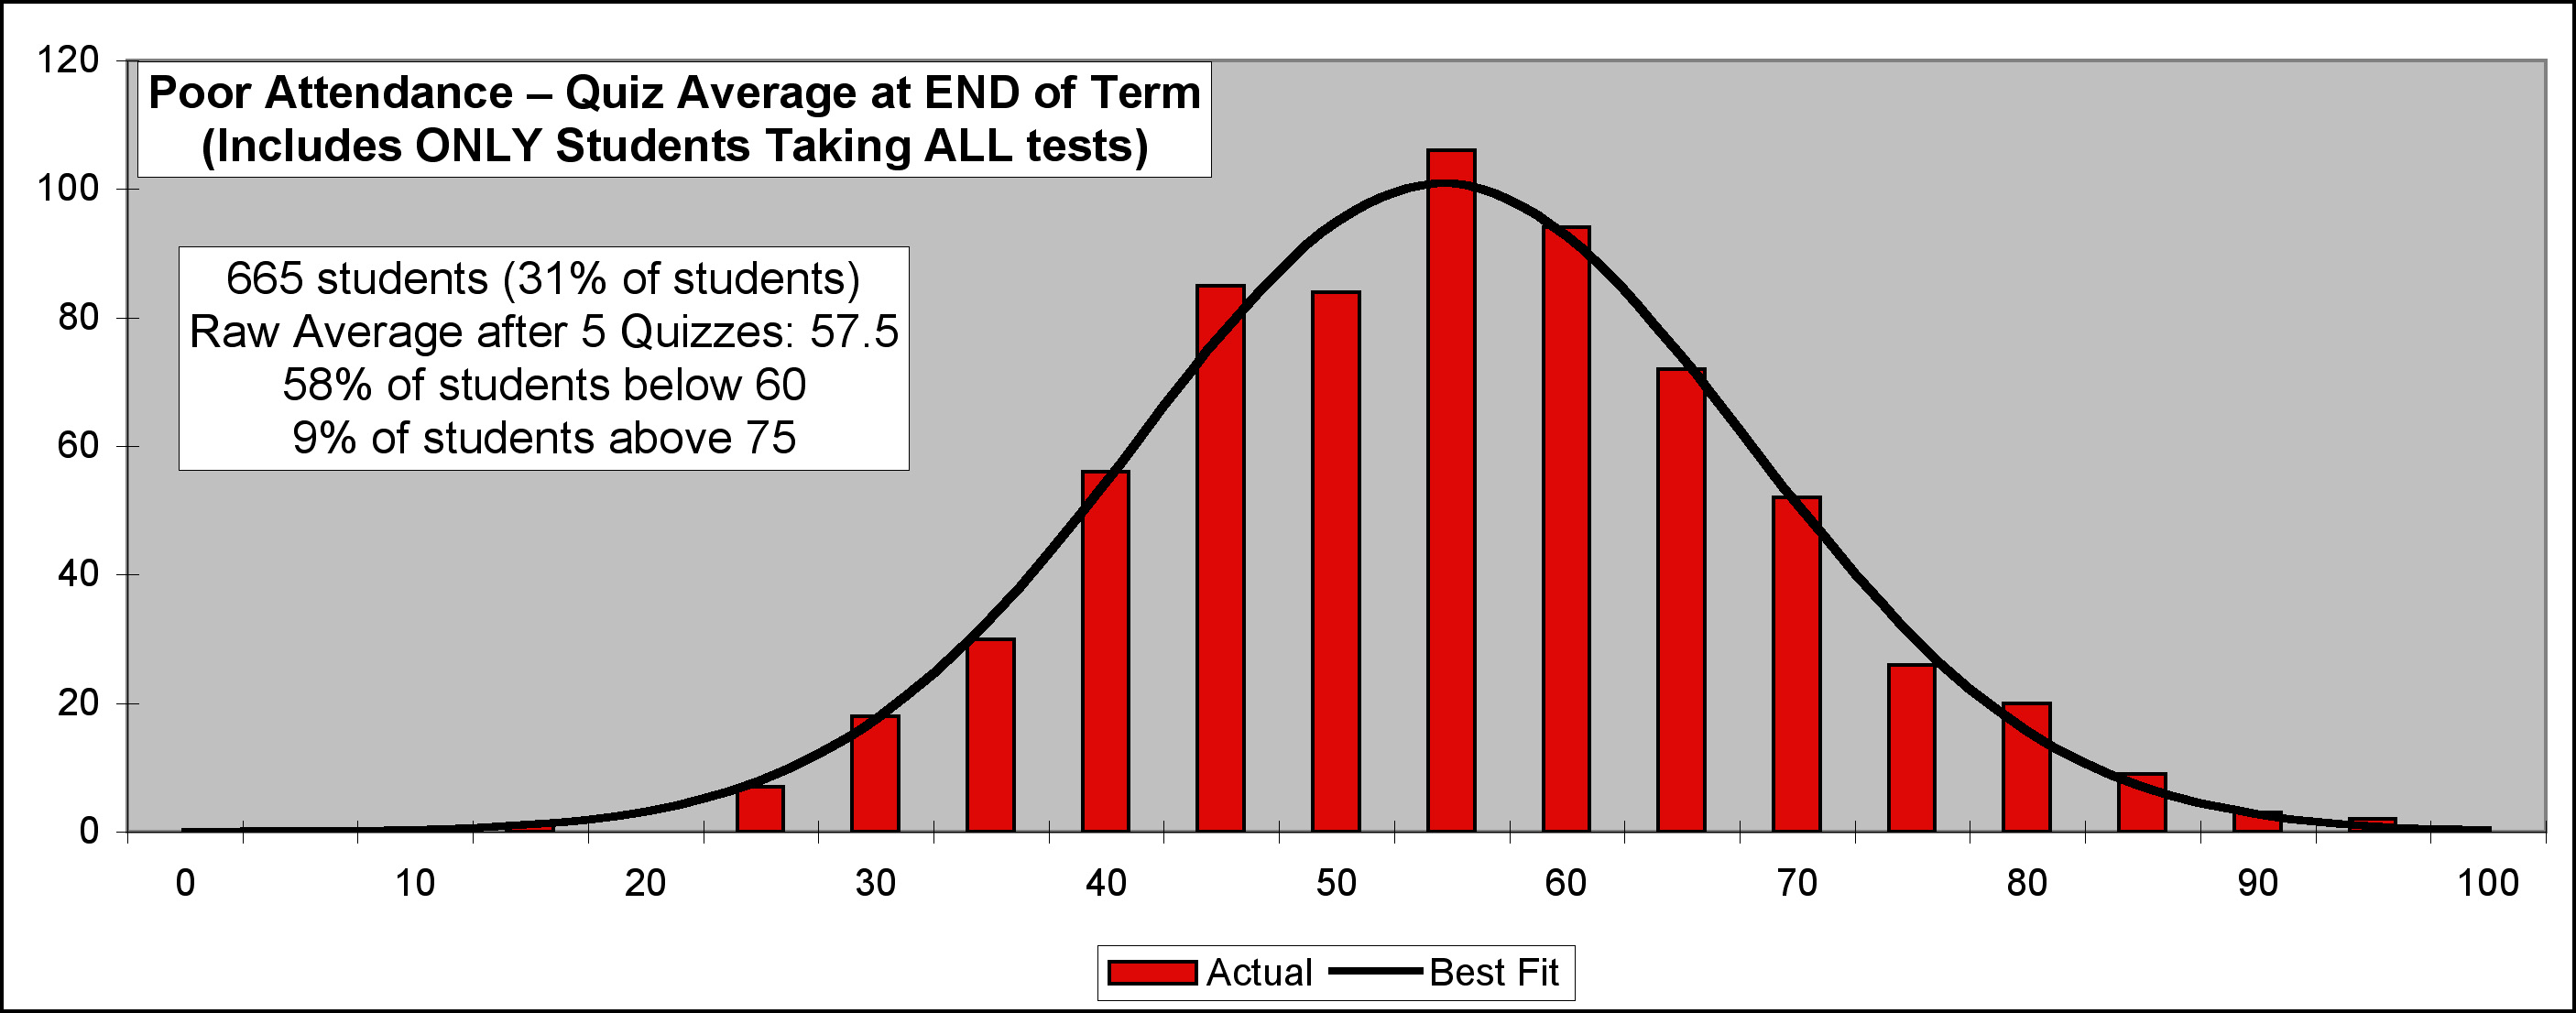
Note well the differences between the Good and Poor plots: the typical student with Poor
attendance averages out to be more than ten points lower on the quizzes than an
average student with Good attendance, at the end of the term. Even at the high end, the
difference is clear: the very best students with Poor attendance score five points lower
than the very best students with Good attendance. (So much for Argument 2, eh?
Nobody does better–or even as good
–by NOT going to class as they
could by going to class. If there were any validity to such a claim, the plots would match at the
high end, in the scores of exceptional students for whom attendance doesn't matter
.)
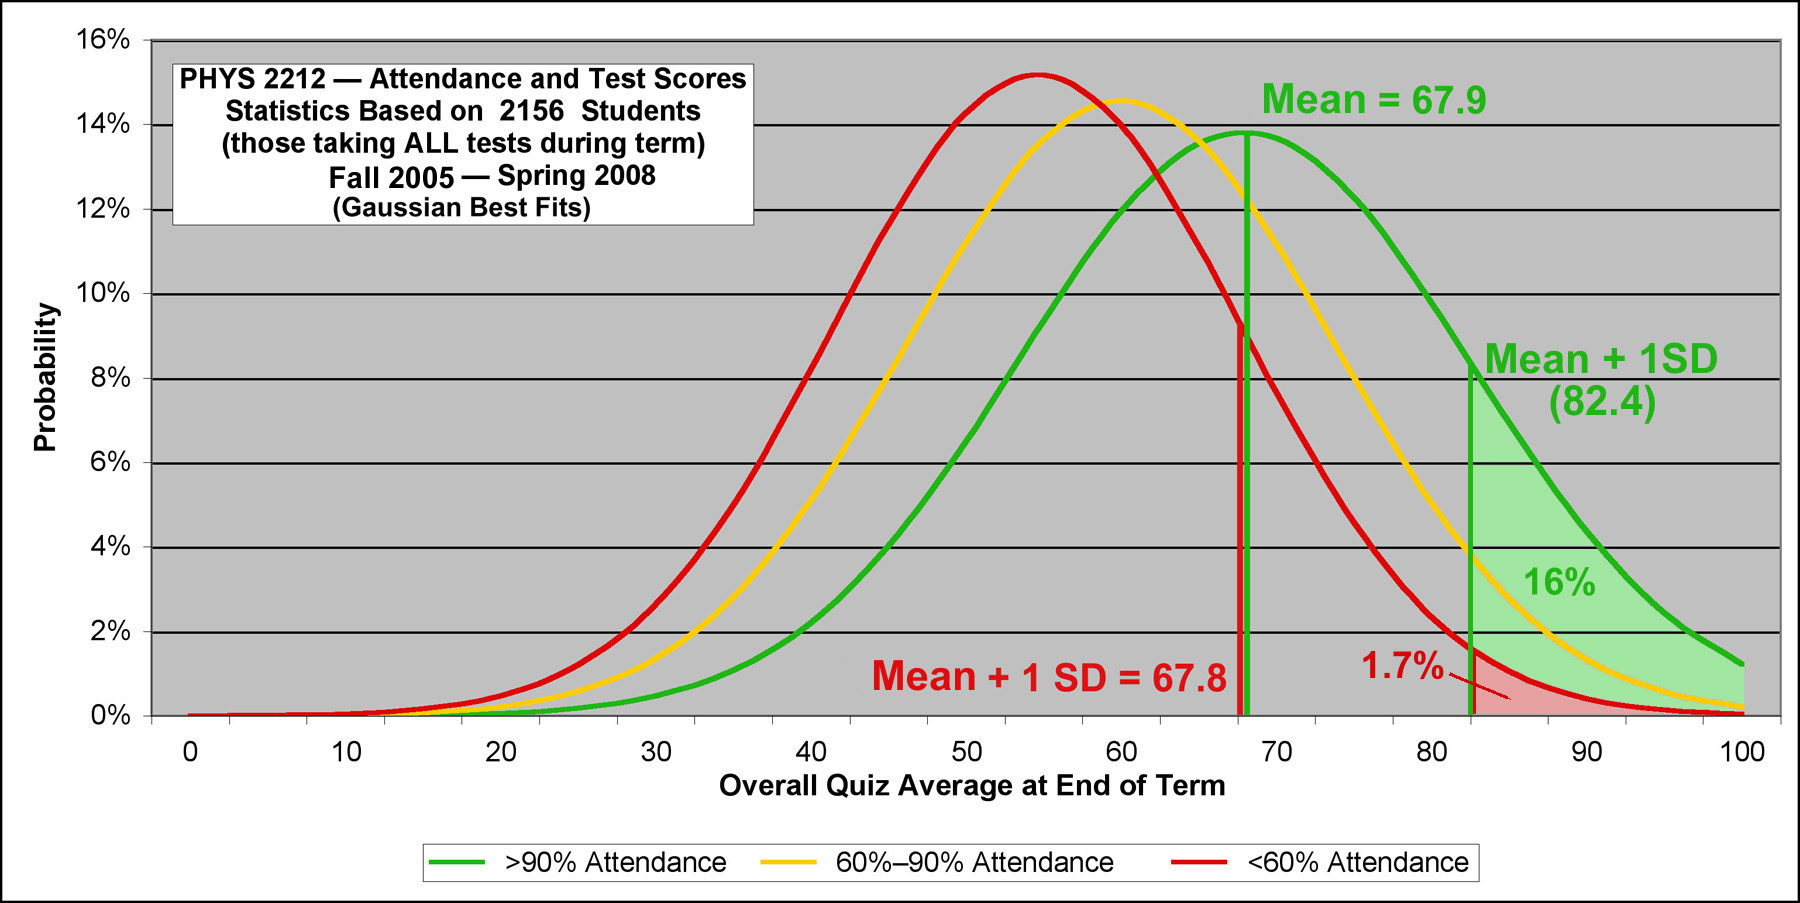
Just to drive this point home, let's look at the Gaussian fits for each of the three categories:
|
You may not be familiar with Gaussian distributions, so let's quickly point out some standard results. In a Gaussian, 68% of the populations will fall within one standard deviation of the mean (above or below). Of the remainder, 16% will be one SD or more above the mean and 16% will be one SD or more below the mean. With that in mind, note:
- An
average
student with Poor attendance, scoring the mean value of 54.6%, would only rank among the bottom 18% of students with Good attendance.
- Students with Poor attendance who are one SD above their mean (score = 67.8) are
still below the mean score of students with Good attendance (score = 67.9). This
means that only 16% of students with Poor attendance will exceed the mean score of students
with Good attendance. If we were to define a
good student
as someone whose test scores are merely above average, then 84% of students with Poor attendance are notgood students
, when compared to those with Good attendance.
- Students with Good attendance who are one standard deviation above the mean have quiz averages
of 82.4 or better. Students with Poor attendance would have to be 2.1 standard deviations
above their mean to earn that same score. Statistically only 1.7% of a Gaussian
population will exceed the mean by that much. If we were to define a
very good student
as someone whose test scores are in the top 16% of the class, then 98.3% of students with Poor attendance are notvery good
, when compared to those with Good attendance.
- Consider a score of 61, which looks to be roughly the place where the Good attendance and
Poor attendance distributions cross one another. Note that this particular score
is also roughly at the dividing line between having a
C
and aD
at the end of the term (assuming typical values for homework, lab, and recitation, and a final exam score that is equal to the quiz average). The majority of students with Good attendance will have test averages above the C/D line (roughly, two-thirds of them), while the majority of students with Poor attendance will have test averages below the C/D line (again, roughly two-thirds of them).
Conclusions
-
If you are an exceptional student:
If you don't go to class, you can expect that your quiz average–although probably high–is likely to be about 5 points lower than it might otherwise be. Since quizzes are typically half your grade, that's a loss of 2.5 points from your final score; add in the 2.5 PRS points you'll be missing as well, and you end up roughly 5 points lower overall. The good news is that you can still earn an A; the bad news is that your effective window is now only half as large (90–95, instead of 90–100). If you can accept those odds, fine–but don't forget the letter grade plots, above: although the window will only be halved in size, the success rate in reaching that window has historically been six times smaller (7% A's versus 45% A's).
-
If you are a typical student:
If you maintain a Poor attendance rate, you can expect your quiz average to be about ten to twelve points lower than it might otherwise be–a loss of 5 to 6 points from your overall final score. When you factor in the missed PRS points as well, you are down something like 7 to 9 points. Odds are, you are going to lose a letter grade in the course, compared to what you might otherwise earn.
-
If you are a struggling student:
You need every point you can get. Don't listen to anyone who tries to throw Argument 2 at you—they do not really know what they are talking about. Go to class.
A Final Caveat
It goes without saying that go to class
really means Prepare
for class by reading ahead, Pay attention to what is being discussed,
and Participate actively in the PRS activities.
If you are sitting
in the back and reading a paper, doing you homework, or goofing off on your laptop, you're not
going to get any real benefit, and of course you will reach the conclusion that going
to class is worthless–but that will be your fault, not that of the
instructor. You will get out of class attendance only as much as you put into the
three P
s above.